
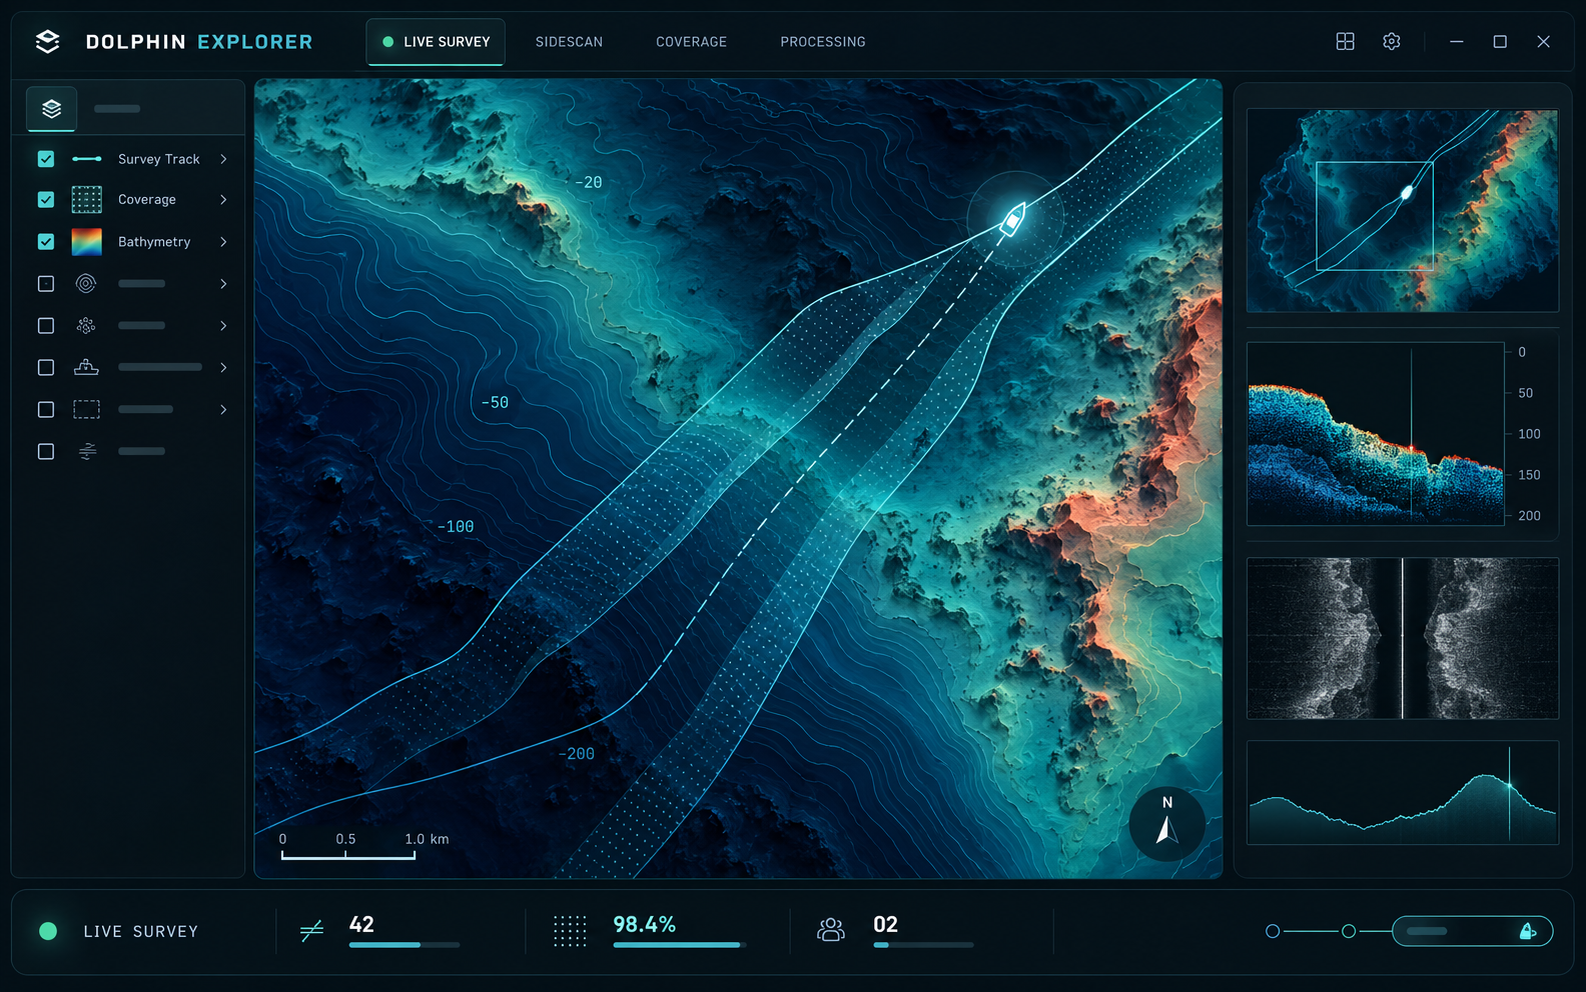
 ILLUSTRATIVE WORKSPACE
01 / Spatial context
See the survey as a whole.
Bring survey tracks, rasters, and sonar imagery into one workspace, with GPU rendering for dense spatial data.
Explore the workspace →HYDROGRAPHIC INTELLIGENCE
One workspace for hydrographic survey data—from vessel-based acquisition to post-survey analysis. Import sonar, inspect quality, interpret the seabed, and turn raw data into deliverables with repeatable processing.
Survey workflows
Work with data from crewed survey vessels and USVs, inspect incoming lines during acquisition, or revisit recorded surveys in the office. The same workspace supports quality control, interpretation, and processing throughout the survey workflow.
Recorded + incoming dataLoad survey files or monitor a folderNavigation + sonar + coverageInspect during acquisition or afterwardSaved processing graphProduce repeatable results and exportsImport recorded XTF, JSF, and SEG-Y files, or monitor a survey folder for incoming lines during acquisition. Organize sources and layers in one project.
Review navigation, coverage, sidescan imagery, and sub-bottom profiles. Use quality-control tools while collecting data or during a detailed review back in the office.
Apply saved processing graphs to survey data, reuse cached results, and export derived products for further analysis and reporting.
Platform
A native C++20 and Qt 6 foundation keeps dense spatial data responsive while the processing engine takes repetitive work off the operator.
ILLUSTRATIVE WORKSPACE01 / Spatial context
Bring survey tracks, rasters, and sonar imagery into one workspace, with GPU rendering for dense spatial data.
Explore the workspace →02 / Inspection
Sidescan waterfall and sub-bottom views support interpretation alongside the map.
Explore quality control →03 / Processing
Save processing recipes and reuse cached results when inputs have not changed.
Try the processing example ↓The 3D map and sidescan waterfall draw through OpenGL, so survey coverage, rasters, and sonar imagery stay responsive as you explore.
Build processing as a node graph once, save it as JSON, and run it again on the next survey. Validation catches broken graphs before they run.
Processing, QC, and reporting run as workers with typed inputs and outputs, so each step knows exactly what it consumes and produces.
Workers cache results and run only when their inputs are dirty. Change one parameter and only the affected branch recomputes.
Automation
Correction, filtering, enhancement, and export nodes chain into a graph that runs in dependency order, with cached steps skipped automatically.
Choose an edit, then run the example to trace its effect through the graph.
Changing the filter preserves input and correction results. The filter, enhancement, and export need to run again.
Illustrates dependency tracking. No survey data is processed in this example.
Roadmap
Every action already flows through typed services and serializable graphs, the foundation for driving Dolphin Explorer with language and agents.
An in-app conversation panel for asking Dolphin to open a layer, run processing, or change a setting in plain language.
A Model Context Protocol interface so AI agents and external tools can drive projects, run graphs, and read results programmatically.
Formats
Raster I/O is backed by GDAL, and coordinate transforms by PROJ.
Format detailsQuickstart
Set up the Windows toolchain, compile the source, and open your first survey. The docs walk through each step.
Full setup guide