
Features
DE / PLATFORM SYSTEMOne workspace. The whole survey workflow.
Import, inspect, interpret, process, and export hydrographic data in one native workspace—from incoming vessel data to detailed post-survey analysis.
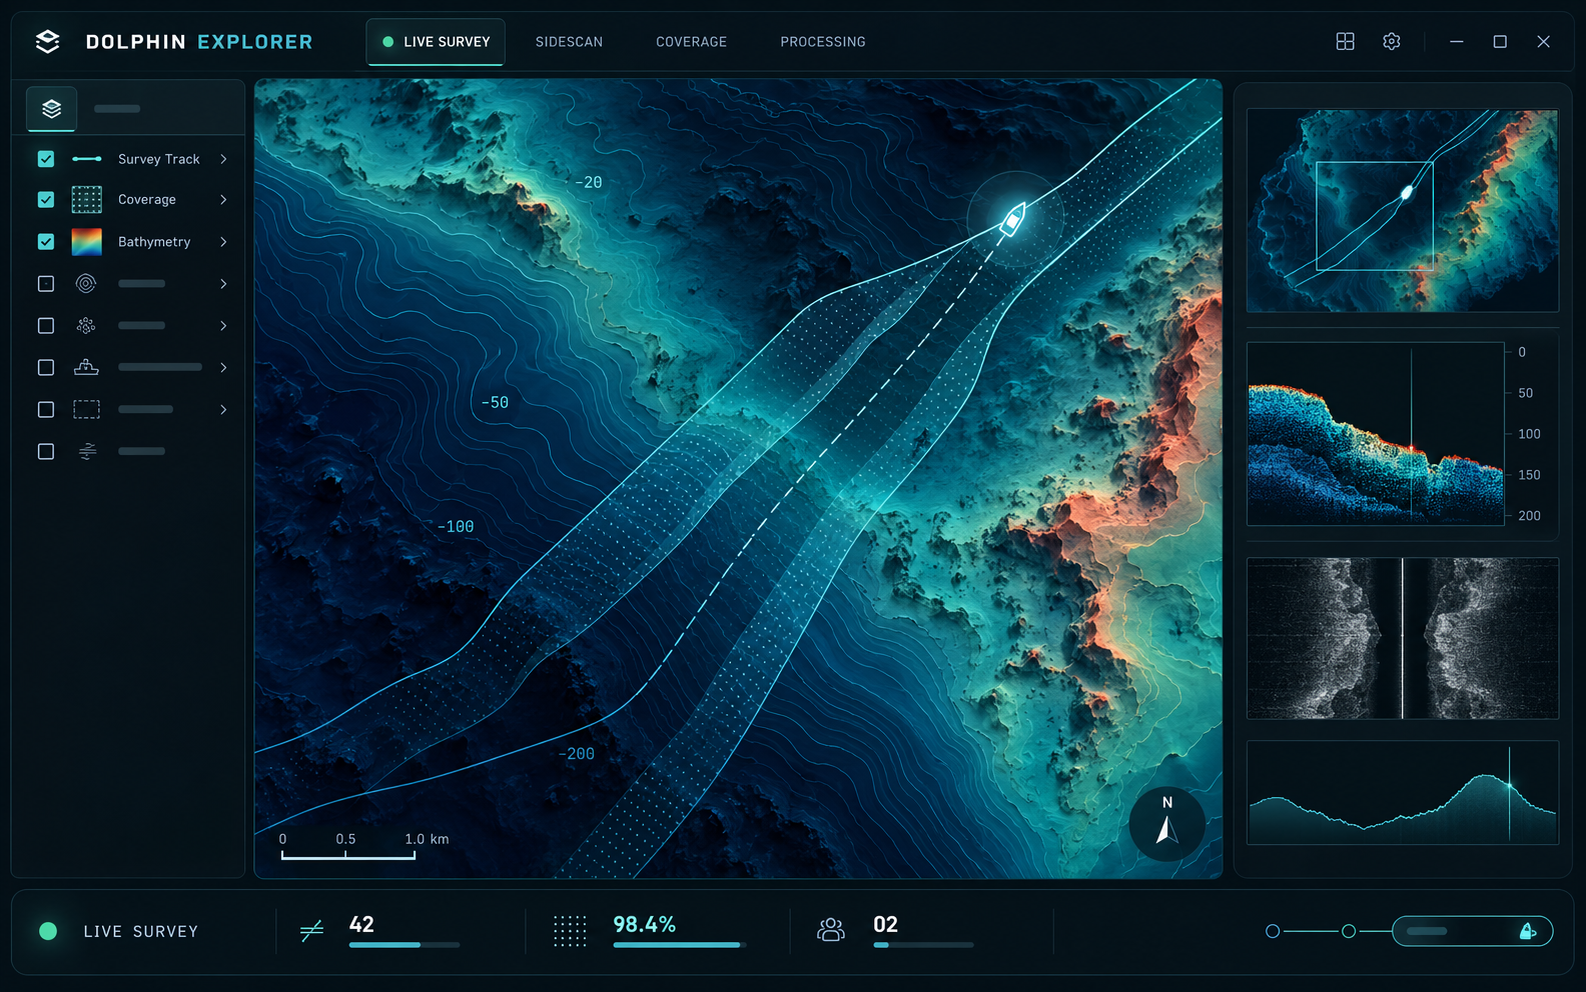
Acquisition and quality control
Inspect in the field. Review in the office.
Monitor incoming files from crewed vessels or USVs, or inspect recorded survey lines after acquisition. Folder monitoring supports live workflows; navigation, seabed, and review-coverage tools support quality checks throughout the project.
Folder monitoring
- Watches survey folders for new XTF, JSF, and SEG-Y lines.
- Ingests new lines automatically as they land, using the same probe-and-index import as manual loading.
- Duplicate detection keeps a line from being imported twice.
Live QA/QC
- Seabed auto-detection with threshold and first-return methods, port/starboard agreement, and continuity gating.
- Navigation smoothing and repair for noisy or dropped positions.
- Review-coverage strip beside the waterfall shows which parts of each line have been inspected.
Engine
GPU on screen. Automation underneath.
GPU rendering
- OpenGL 3D map with an interactive camera for tracks, coverage, contacts, and draped rasters.
- OpenGL sidescan waterfall renderer for reviewing long lines.
- Palette and radiometric controls for sidescan display.
Automated processing
- Node graphs validated before they run and executed in topological order.
- Graphs serialize to JSON, so a processing recipe can be saved and reused across surveys.
- Dirty tracking re-runs only the nodes downstream of a change.
Worker execution
- Processing, QC, reporting, and custom workers with typed input and output contracts.
- Execution policies for parallel runs, result caching, run-on-dirty-only, and priority.
- Clear lifecycle states: idle, dirty, running, cached, completed, failed, blocked.
Background by default
- Import and decode run in the background with progress reporting and cancellation.
- Visible data is decoded first; the rest is refined while you work.
- Heavy import and decode work is capped at two concurrent jobs to keep the UI responsive.
Automation
A processing recipe you can run again.
Chain nodes into a graph, save it, and apply it to the next survey. Workers pick up the graph, skip cached steps, and recompute only what a change affects.
- InputSidescan inputCached
- CorrectionSlant-range correctionCached
- FilterSpeckle filterRunning
- EnhancementGain normalizationDirty
- OutputGeoTIFF exportIdle
processingRuns correction, filter, and enhancement graphsqcRuns quality-control graphs over processed layersreportingTurns graph outputs into report artifacts
Workflows
Import, interpret, and export.
Survey import and organization
- Probes supported survey files automatically before import.
- Classifies available modalities and creates one or more project layers from a source file.
- Prevents duplicate imports using the normalized path, file size, and modification time.
- Builds indexes before full sample hydration so large files become visible quickly.
- Prioritizes visible data and decodes the rest in the background.
- Supports cancellation and progress reporting for long-running import and processing jobs.
- Limits heavy import and decode work to two concurrent jobs by default.
Visualization and interpretation
- 2D and 3D map display for survey tracks, sonar coverage, contacts, and georeferenced rasters.
- Sidescan waterfall display with palette and radiometric controls.
- Sub-bottom profile display and correction tools.
- Metadata inspection for imported sources and layers.
- Contact creation, review, snapshots, and measurements.
- Data-library and layer-management workflows.
- Coordinate reference system and geodesy utilities.
Processing and export
- Directed acyclic graph processing with validation, topological execution, dirty tracking, and JSON serialization.
- Sidescan correction, filtering, enhancement, and analysis nodes.
- Navigation smoothing and repair workflows.
- GeoTIFF output for georeferenced elevation or imagery products.
- PNG export for map and application views.
- CSV output through the processing graph.
Data flow
How data moves through the application.
Activating a layer should not require full-file decoding. Detailed samples load according to what you are viewing.
- 01
Probe and classify
Detect the format and the modalities a file contains.
- 02
Index and extents
Establish what the dataset holds and where it belongs.
- 03
Source and layers
Register the source in the project as one or more layers.
Visible-first decode
Map, waterfall, and sub-bottom views
Background refinement
Durable .dlpd artifact
Processing graph
Derived artifacts and exports
Processing graph
Processing nodes, grouped by role.
The graph runs nodes in topological order and propagates changes downstream, so only affected steps re-run.
How the pipeline fits in- Input
- Sidescan, sub-bottom, and multibeam inputs
- Correction
- Slant-range correction, TVG, bottom detection, navigation smoothing, geocorrection, ARC, band-pass
- Filter
- Range clipping, decimation, speckle filtering
- Enhancement
- Gain normalization, contrast enhancement, histogram equalization, sidescan enhancement
- Analysis
- Acoustic-shadow detection
- Merge
- Combines compatible processing branches
- Output
- GeoTIFF and CSV export
Roadmap
AI-ready, by design.
Typed services, serializable graphs, and worker contracts give language and agent interfaces a clean surface to drive.
- In development
Dolphin assistant
An in-app conversation panel for asking Dolphin to open a layer, run processing, or change a setting in plain language. The interface is in the app today; the language backend is being built.
- Planned
MCP server
A Model Context Protocol interface so AI agents and external tools can open projects, run processing graphs, and read results programmatically.